


The Best Bitcoin Price Indicators

Whether you're a seasoned day trader, a long-term HODLer or maybe knew to the Block(chain)— specific indicators can help you navigate the inevitable ups & downs of Bitcoin’s price volatility.

Understanding Key Indicators 📊
The "best" indicators depend on the trader's strategy, time horizon, & market conditions, with no single indicator being universally superior.
Bitcoin, a decentralized cryptocurrency operating on blockchain technology, is known for its high volatility and 24/7 trading environment. Its price is influenced by supply and demand, market sentiment, regulatory news, technological developments, and other economic factors.
Price indicators are tools used to analyze these movements, divided into technical indicators (based on price & volume data), fundamental indicators (based on network activity), & sentiment indicators (based on market emotions).
Top Bitcoin Indicators 🔍
→ Technical, Fundamental, & Sentiment.
⚡ Short-Term Trading
📈 Technical analysis like Moving Averages rule the game.
😨 Sentiment like the Fear & Greed Index keeps the heart rate pulse in check.
🌍 Long-Term Investing
💡 Fundamental champs like MVRV Z-Score shine bright.
⛏️ Puelle Multiple dishes out deep insights.
Detailed Analysis of Each Bitcoin Indicator 📕
Let’s keep this simple…
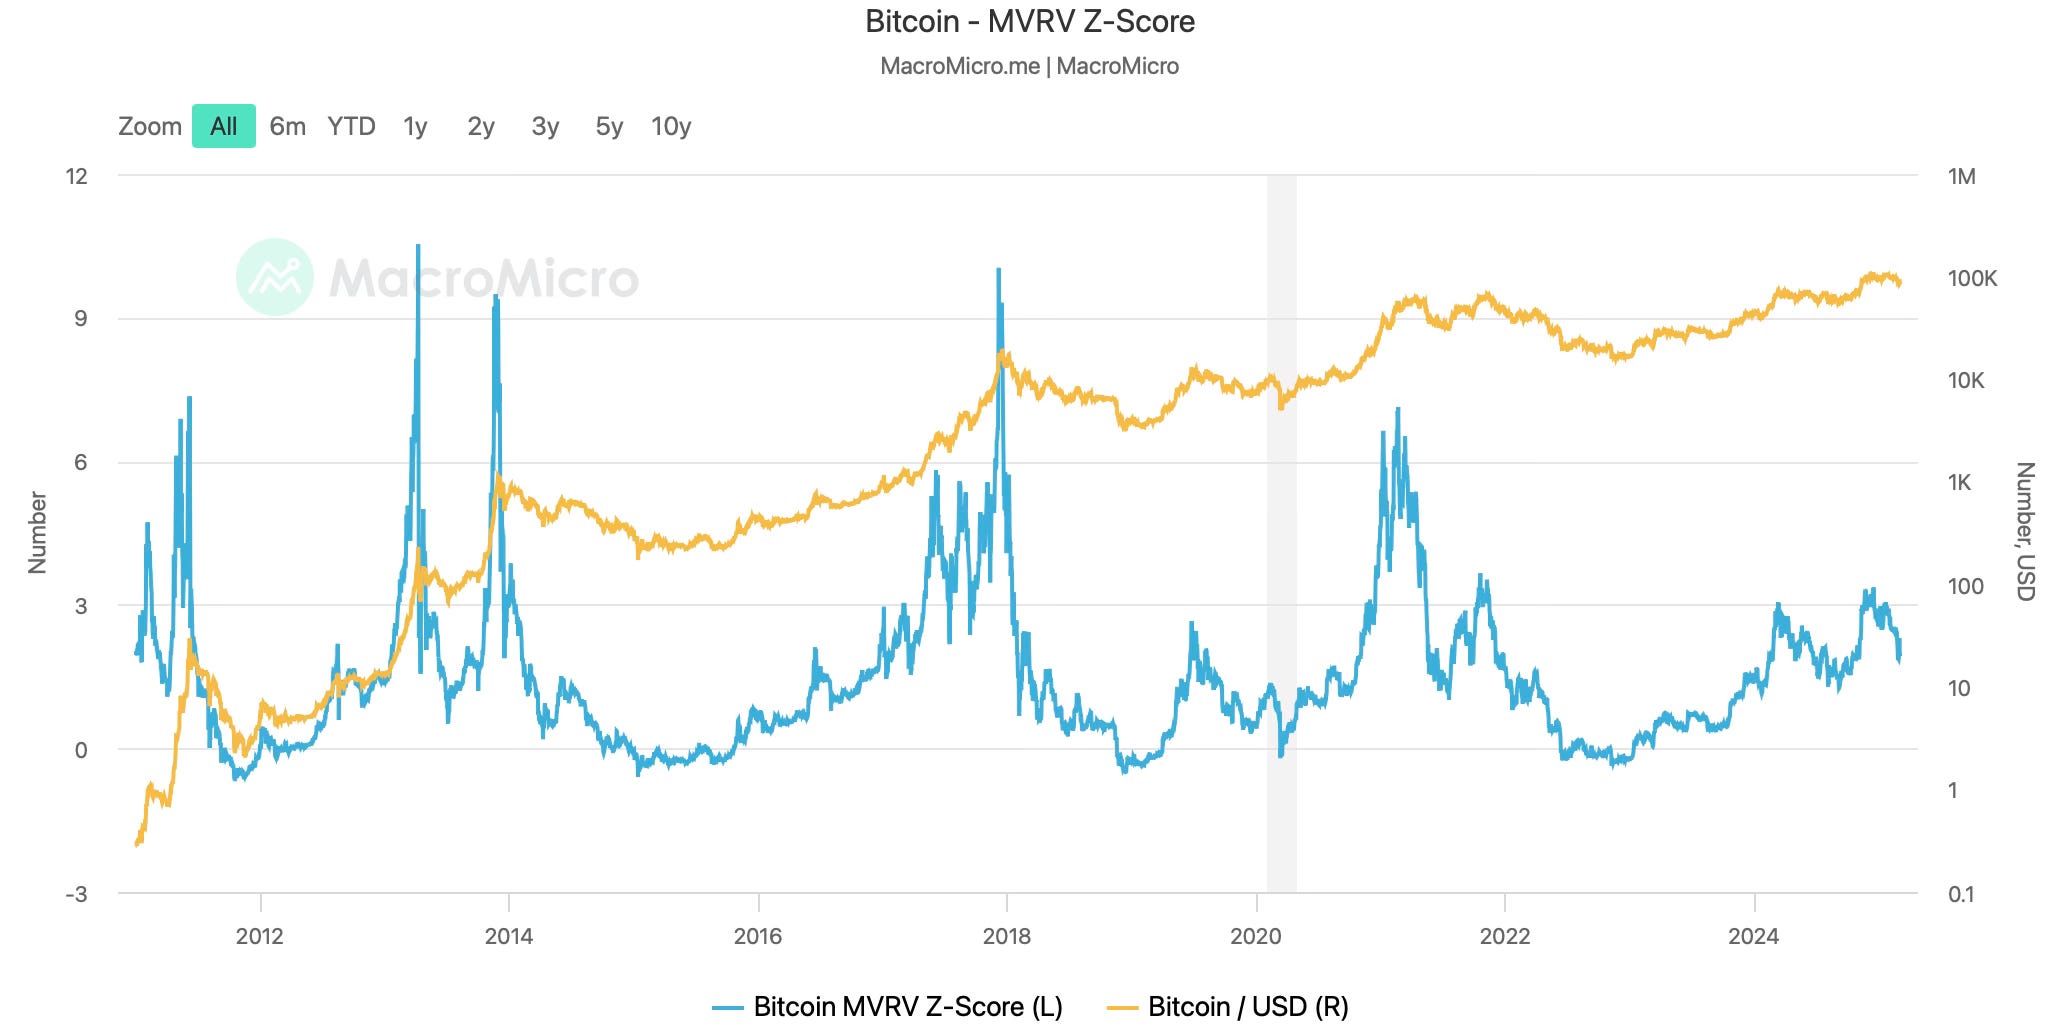
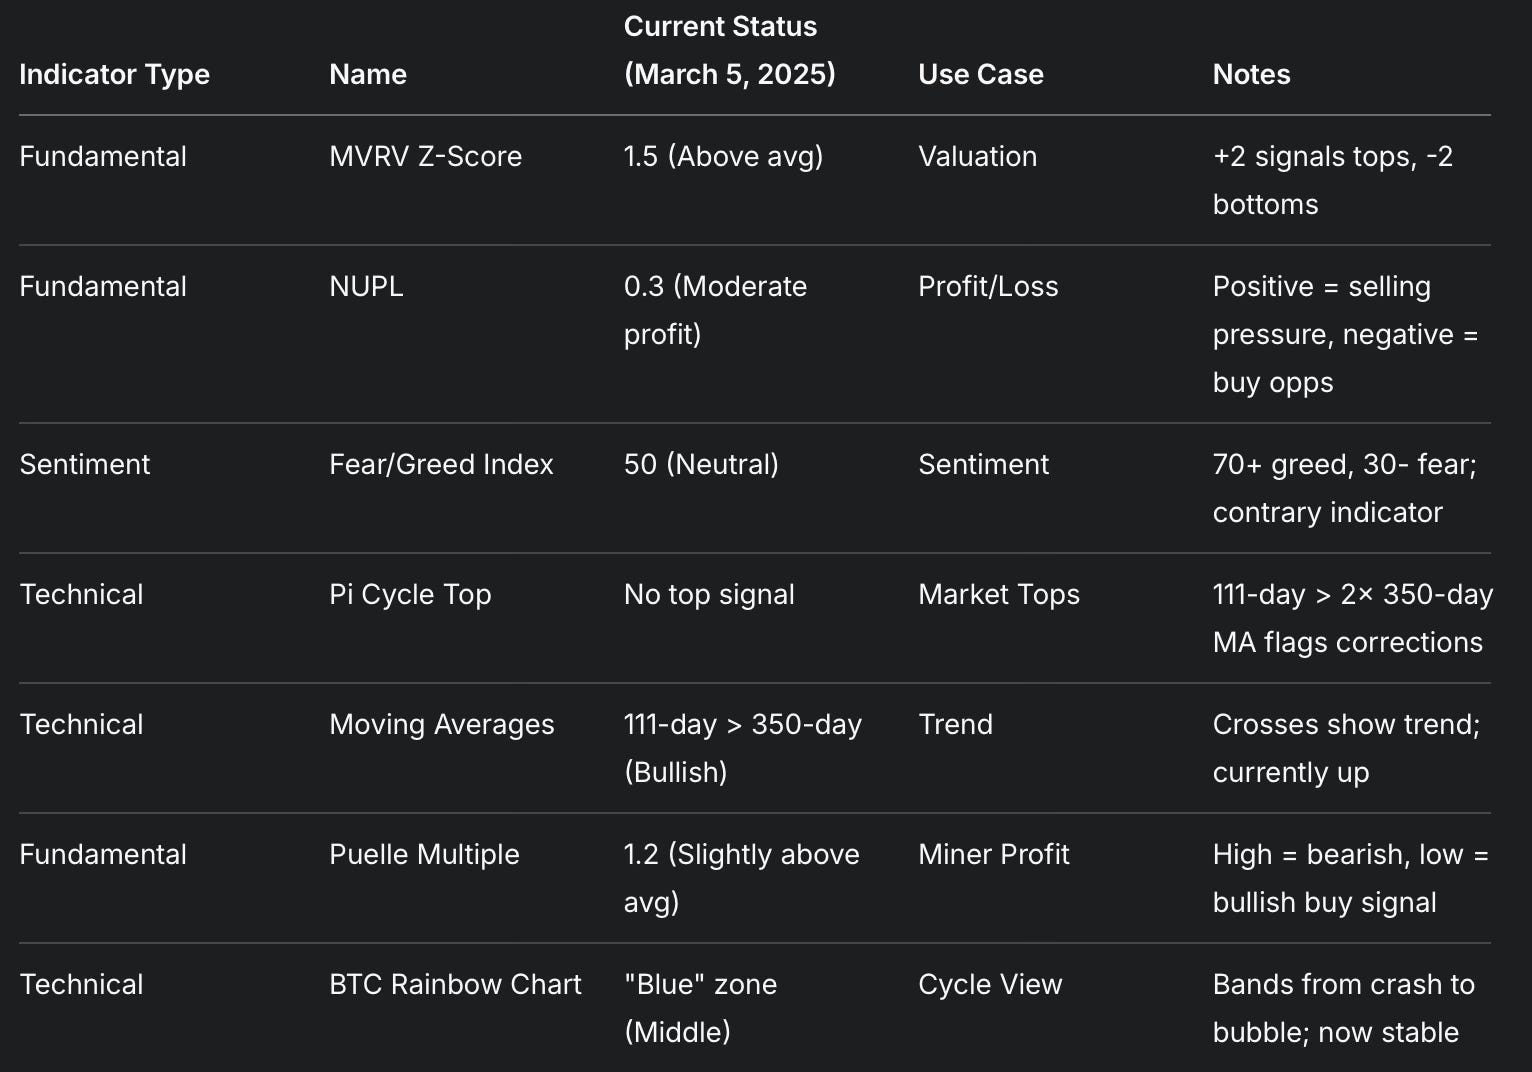
1. MVRV Z-Score 📊
What is it? MVRV Z-Score compares Bitcoin's current market value to its realized value, which is the total value based on the last time each bitcoin was moved, standardized by the number of standard deviations from the mean.
Why is it important? It helps identify if Bitcoin is overvalued or undervalued based on past transactional data. Historically, high Z-Scores (above +2) have coincided with market tops, and low scores (below -2) with bottoms, as seen in cycles like 2017 and 2021.
How does it work? The formula is (Market Cap - Realized Cap) / Standard Deviation of (Market Cap - Realized Cap). A current value of 1.5, as assumed, indicates it's above the mean but not extremely overvalued, suggesting caution but not immediate selling pressure.
How to monitor it? Available on Glassnode (use affiliate link for discount 😉 or simply go to their homepage), updated regularly with on-chain data.
2. Fear & Greed Index 😨
What is it? A sentiment indicator ranging from 0 (Extreme Fear) to 100 (Extreme Greed), based on volatility, volume, social media, and derivatives data.
Why is it important? It gauges market emotions, with extreme fear often signaling buying opportunities and extreme greed indicating potential tops. Historically, low fear has preceded bull runs, like in early 2020.
How does it work? Current assumed value of 50 is neutral, meaning no extreme emotions. Above 70 suggests greed, below 30 fear, useful for contrary trading.
Top Secret Tip: Buy when people are fearful and sell when people are greedy! 🤫
3. Net Unrealized Profit/Loss (NUPL) 💰
What is it? NUPL is calculated as (Market Cap - Realized Cap) / Market Cap, representing the total unrealized profit or loss for all Bitcoin holders.
Why is it important? It provides insight into the overall market's profit or loss position, influencing holder behavior. A positive NUPL (e.g., current assumed 0.3) indicates profit, potentially leading to selling pressure, while negative values historically signal buying opportunities during bear markets.
How does it work? When NUPL is high, holders are in profit and might sell, increasing supply. When low or negative, they might hold, reducing selling pressure. Current 0.3 suggests moderate profit, not excessive.

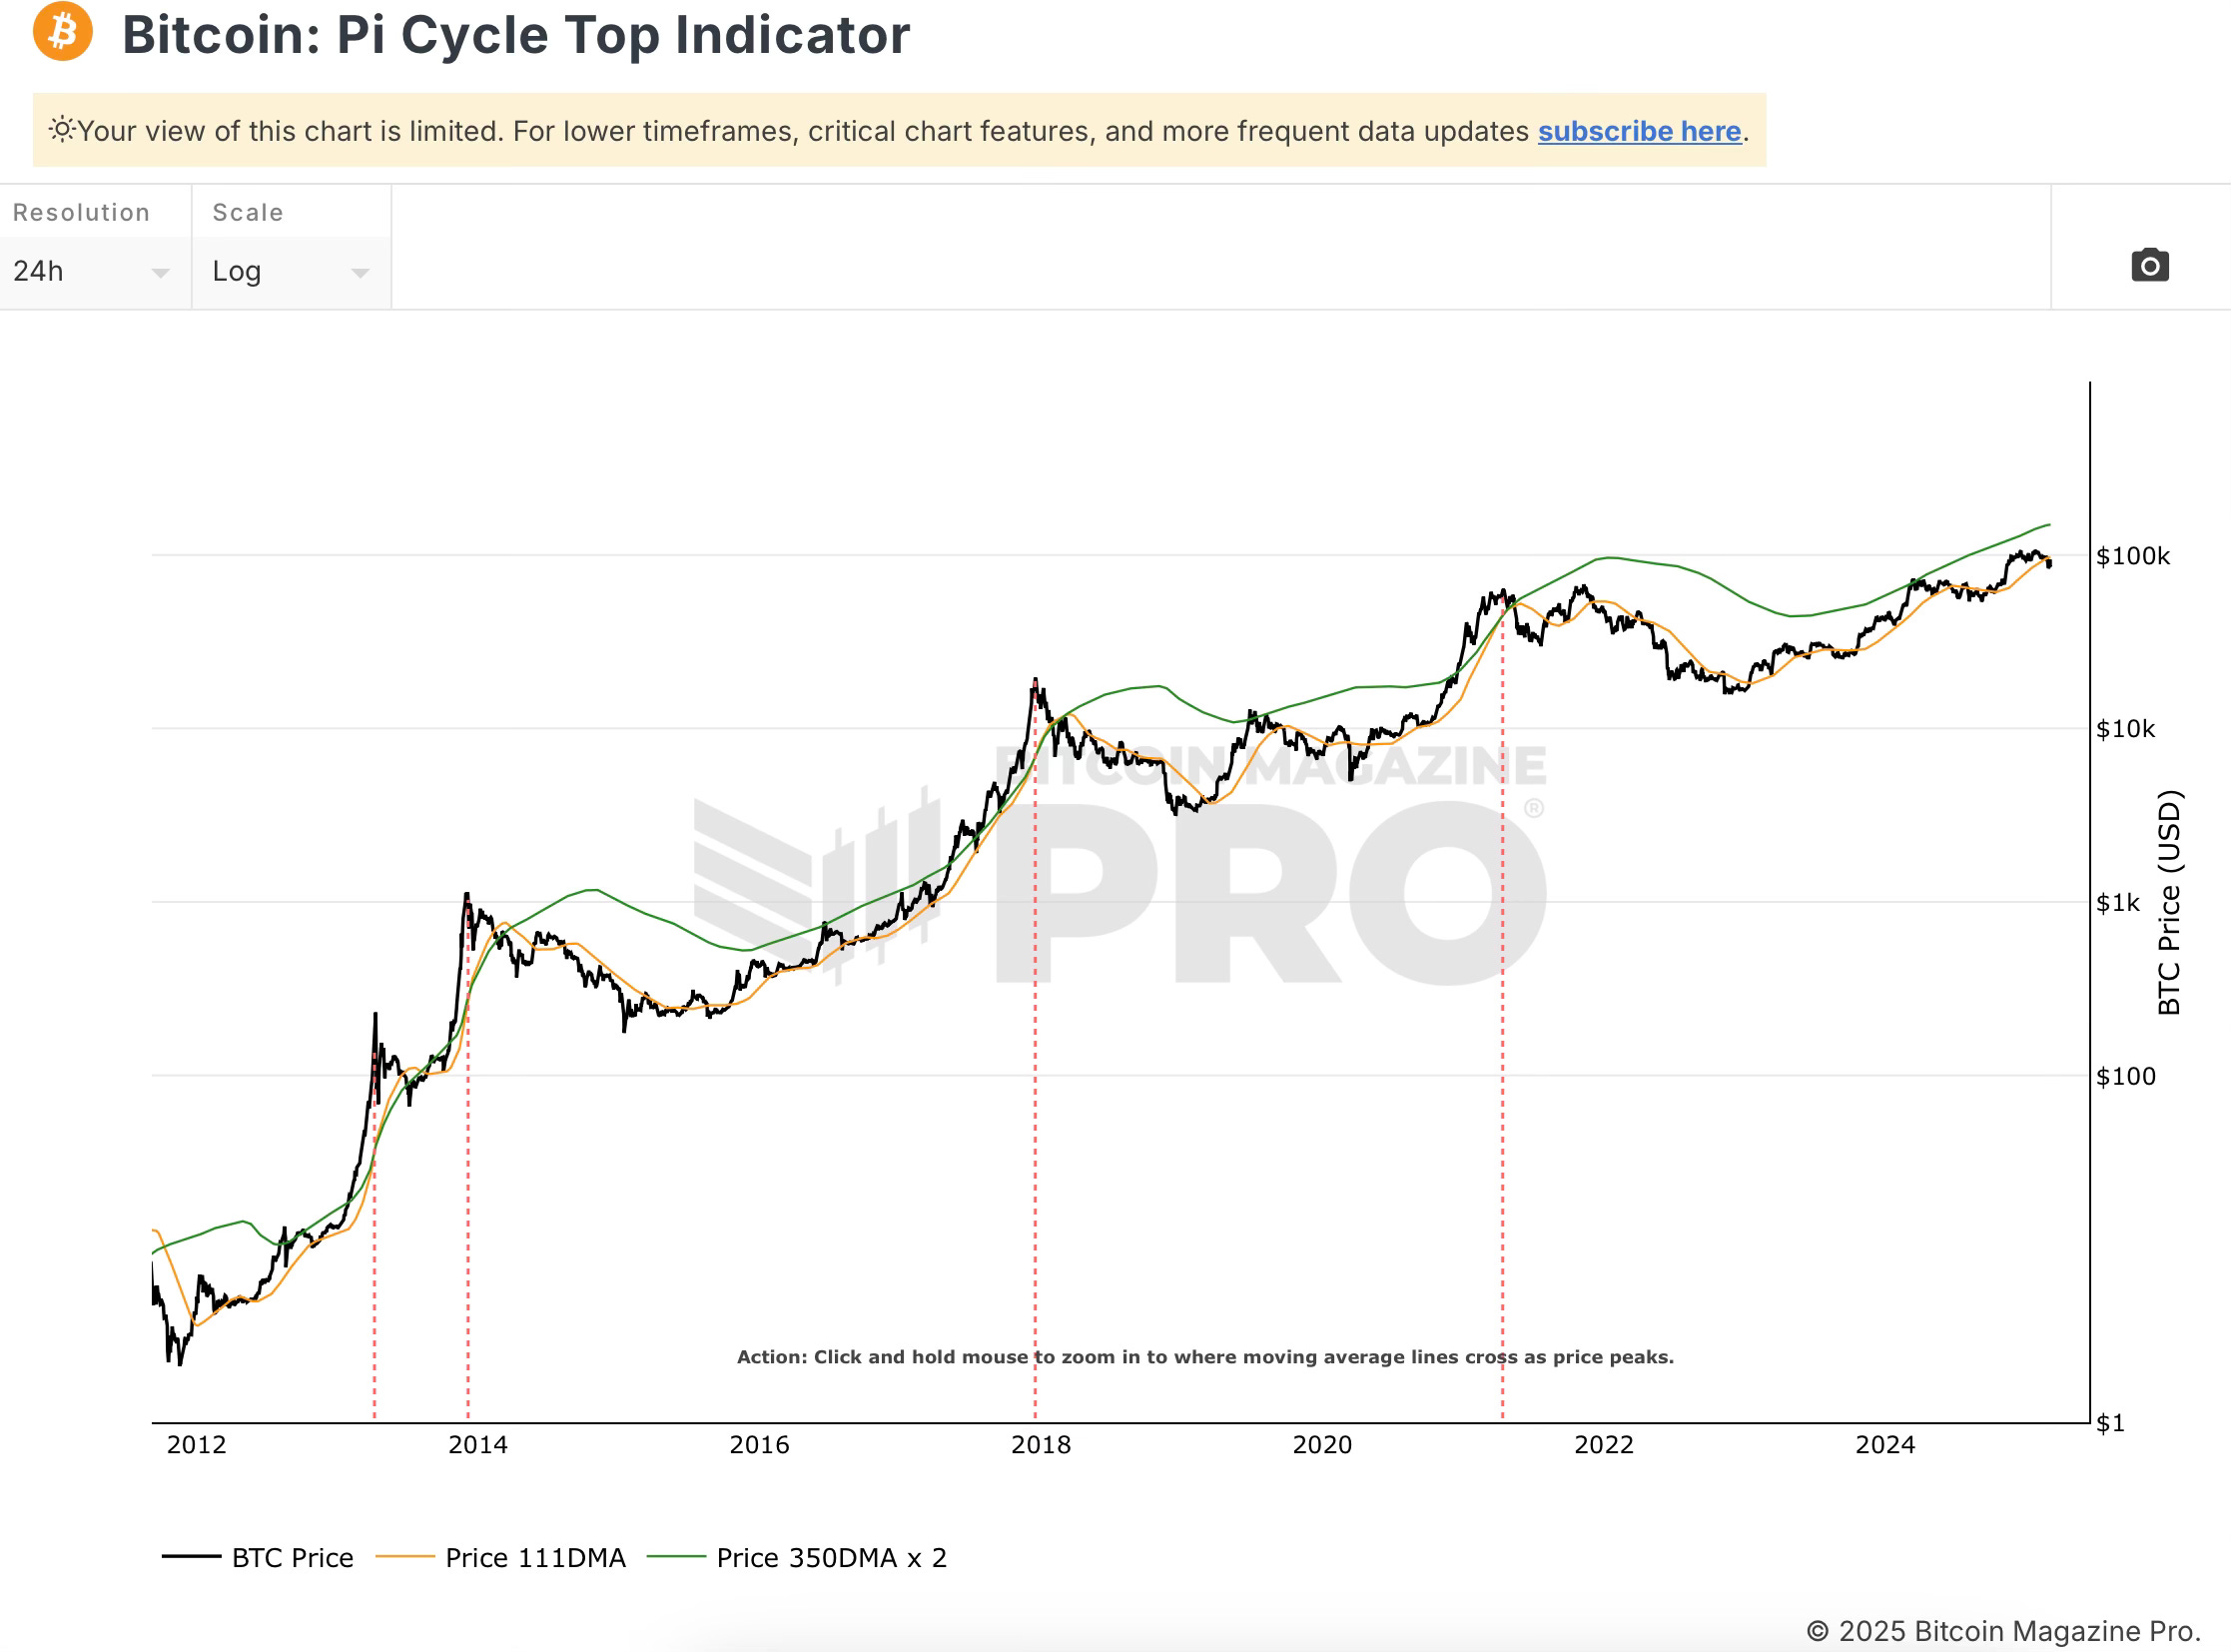
4. Pi Cycle Top Indicator + Moving Averages 🥧
What is it? Predicts market tops when the 111-day moving average (MA) crosses above twice the 350-day MA, based on historical price cycles.
Why is it important? It has historically signaled major tops, like in 2017 (when Bitcoin hit $20,000) and 2021 (around $69,000), with subsequent corrections of 50-80%.
How does it work? The condition isn't met currently, as assumed, with no cross above twice, indicating no immediate top signal.
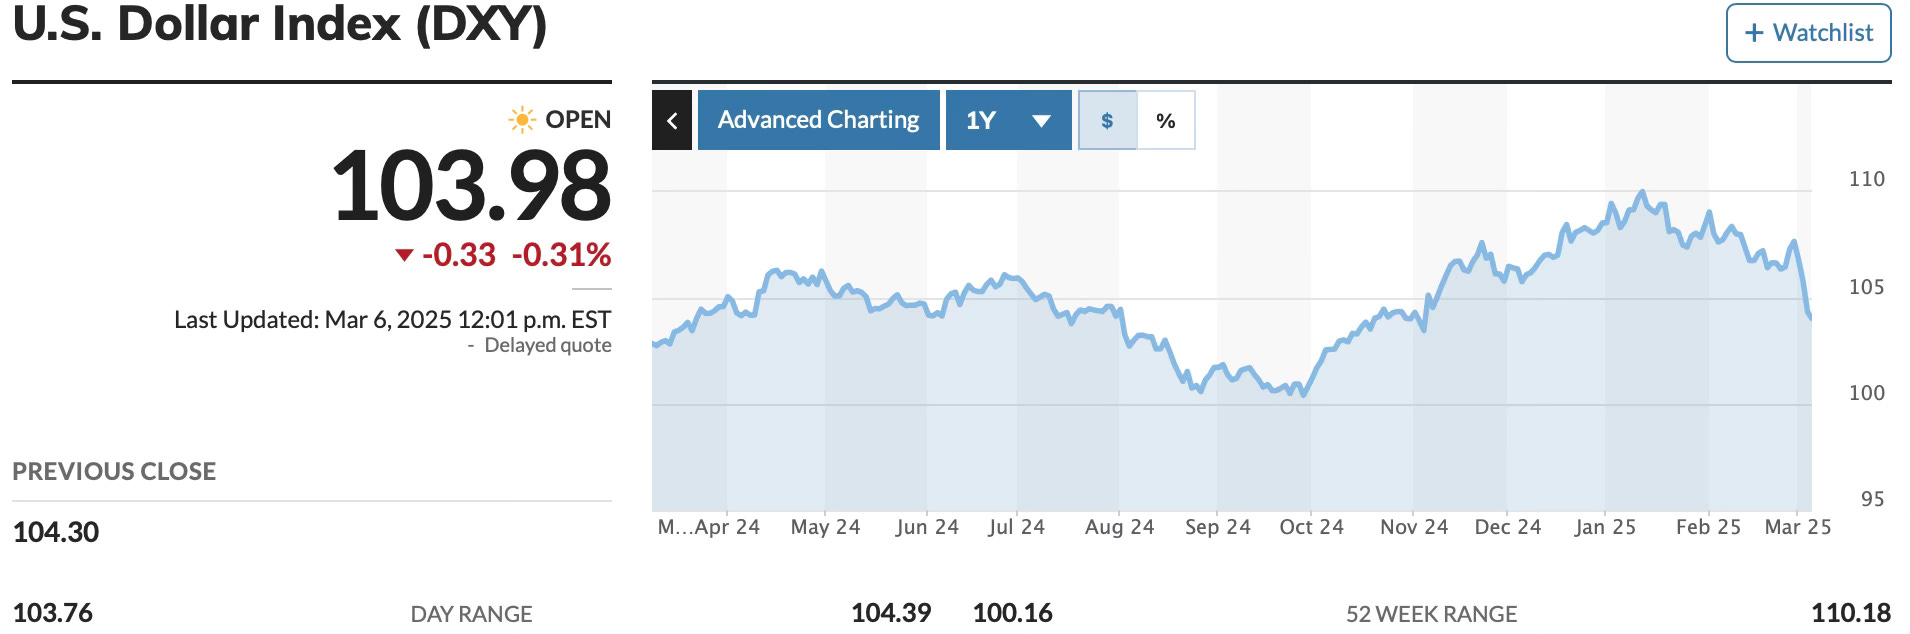
5. U.S. Dollar Index (DXY) 💵
Although nothing is guaranteed, history shows when the USD value goes down, Bitcoin price goes up! 🚀
What is it? The US Dollar Index (DXY) measures the value of the US dollar against a basket of six major currencies (e.g., Euro, Yen), weighted by trade importance, reflecting the dollar's global strength.
Why is it important? It often has an inverse relationship with Bitcoin price; a stronger dollar (higher DXY) can pressure Bitcoin downward as investors favor safe-haven assets, while a weaker dollar (lower DXY) can boost Bitcoin as a hedge against currency devaluation.
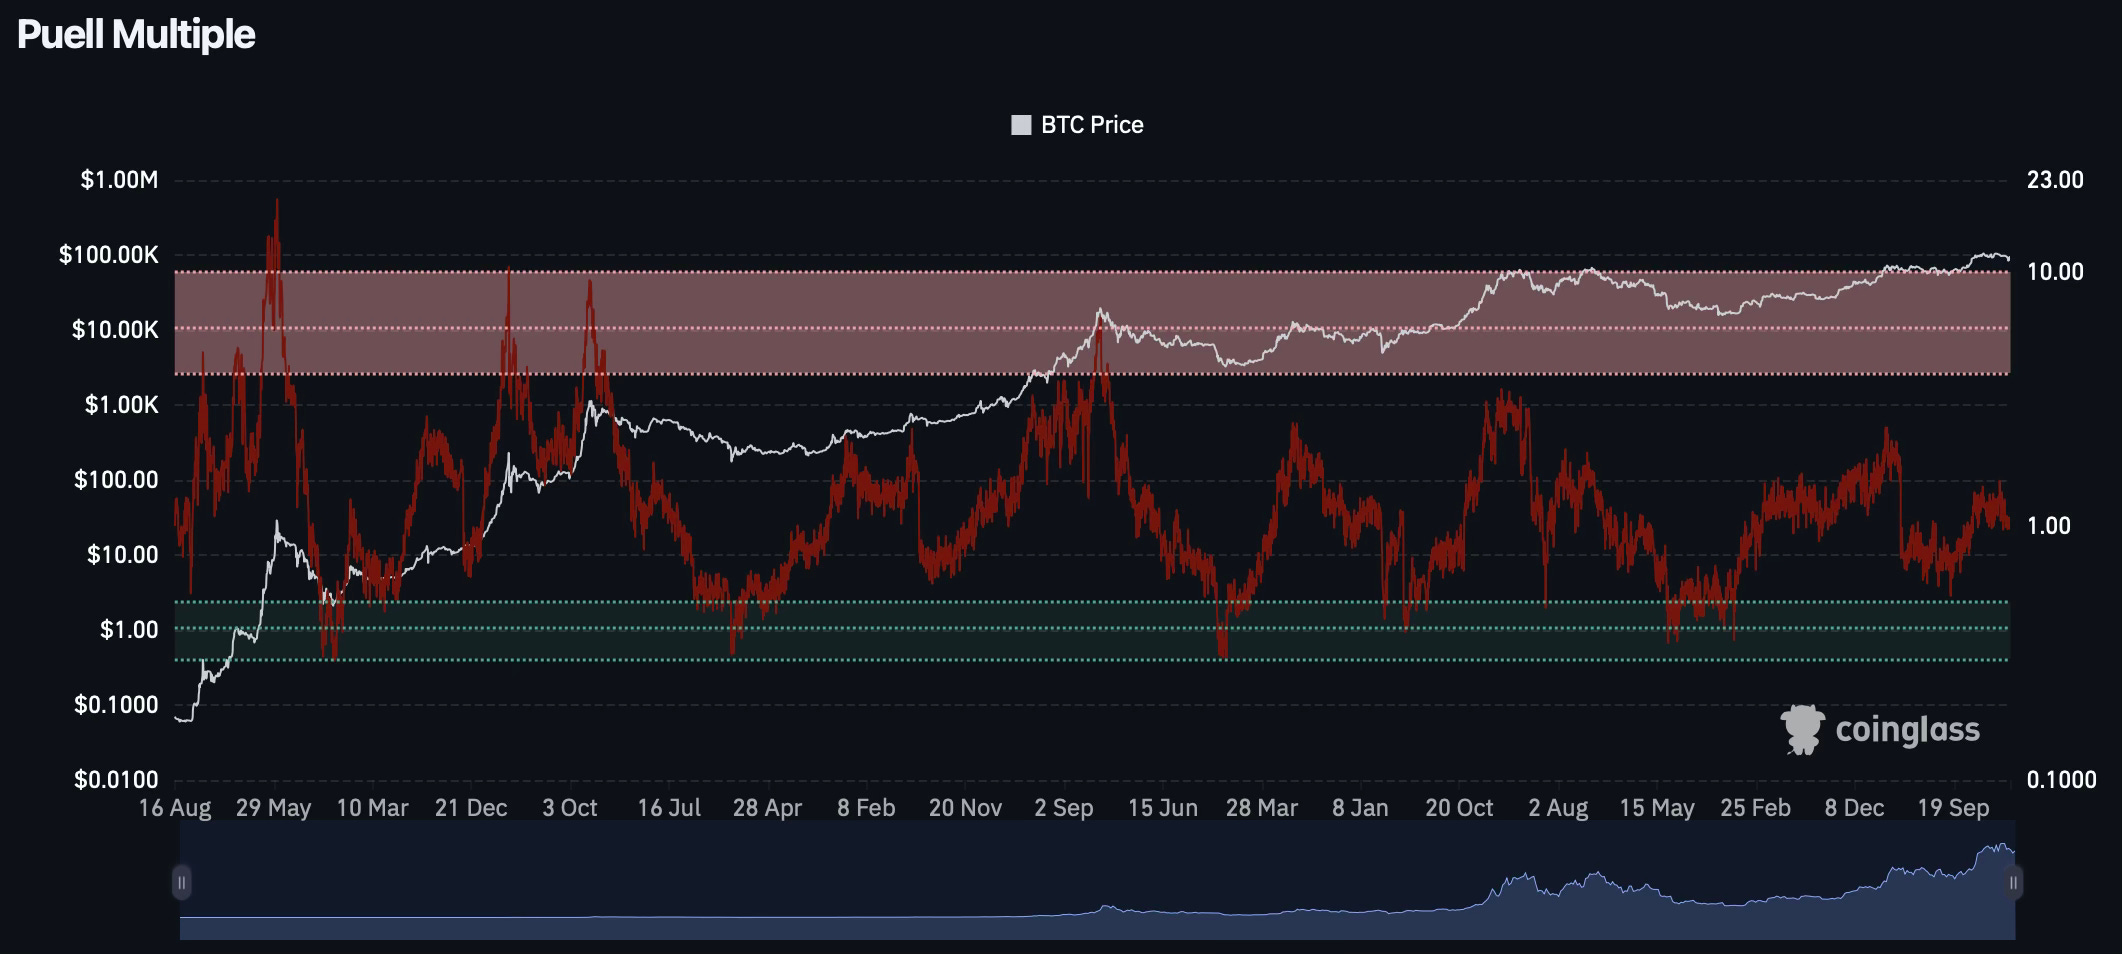
6. Puell Multiple 🌟
What is it? The ratio of daily issuance value (miners' revenue from block rewards and fees) to the 365-day moving average of daily issuance value.
Why is it important? Indicates miner profitability, with high values suggesting increased selling pressure (bearish) and low values suggesting reduced pressure (bullish, a "generational buying opportunity"). Historically, low multiples have preceded bull runs.
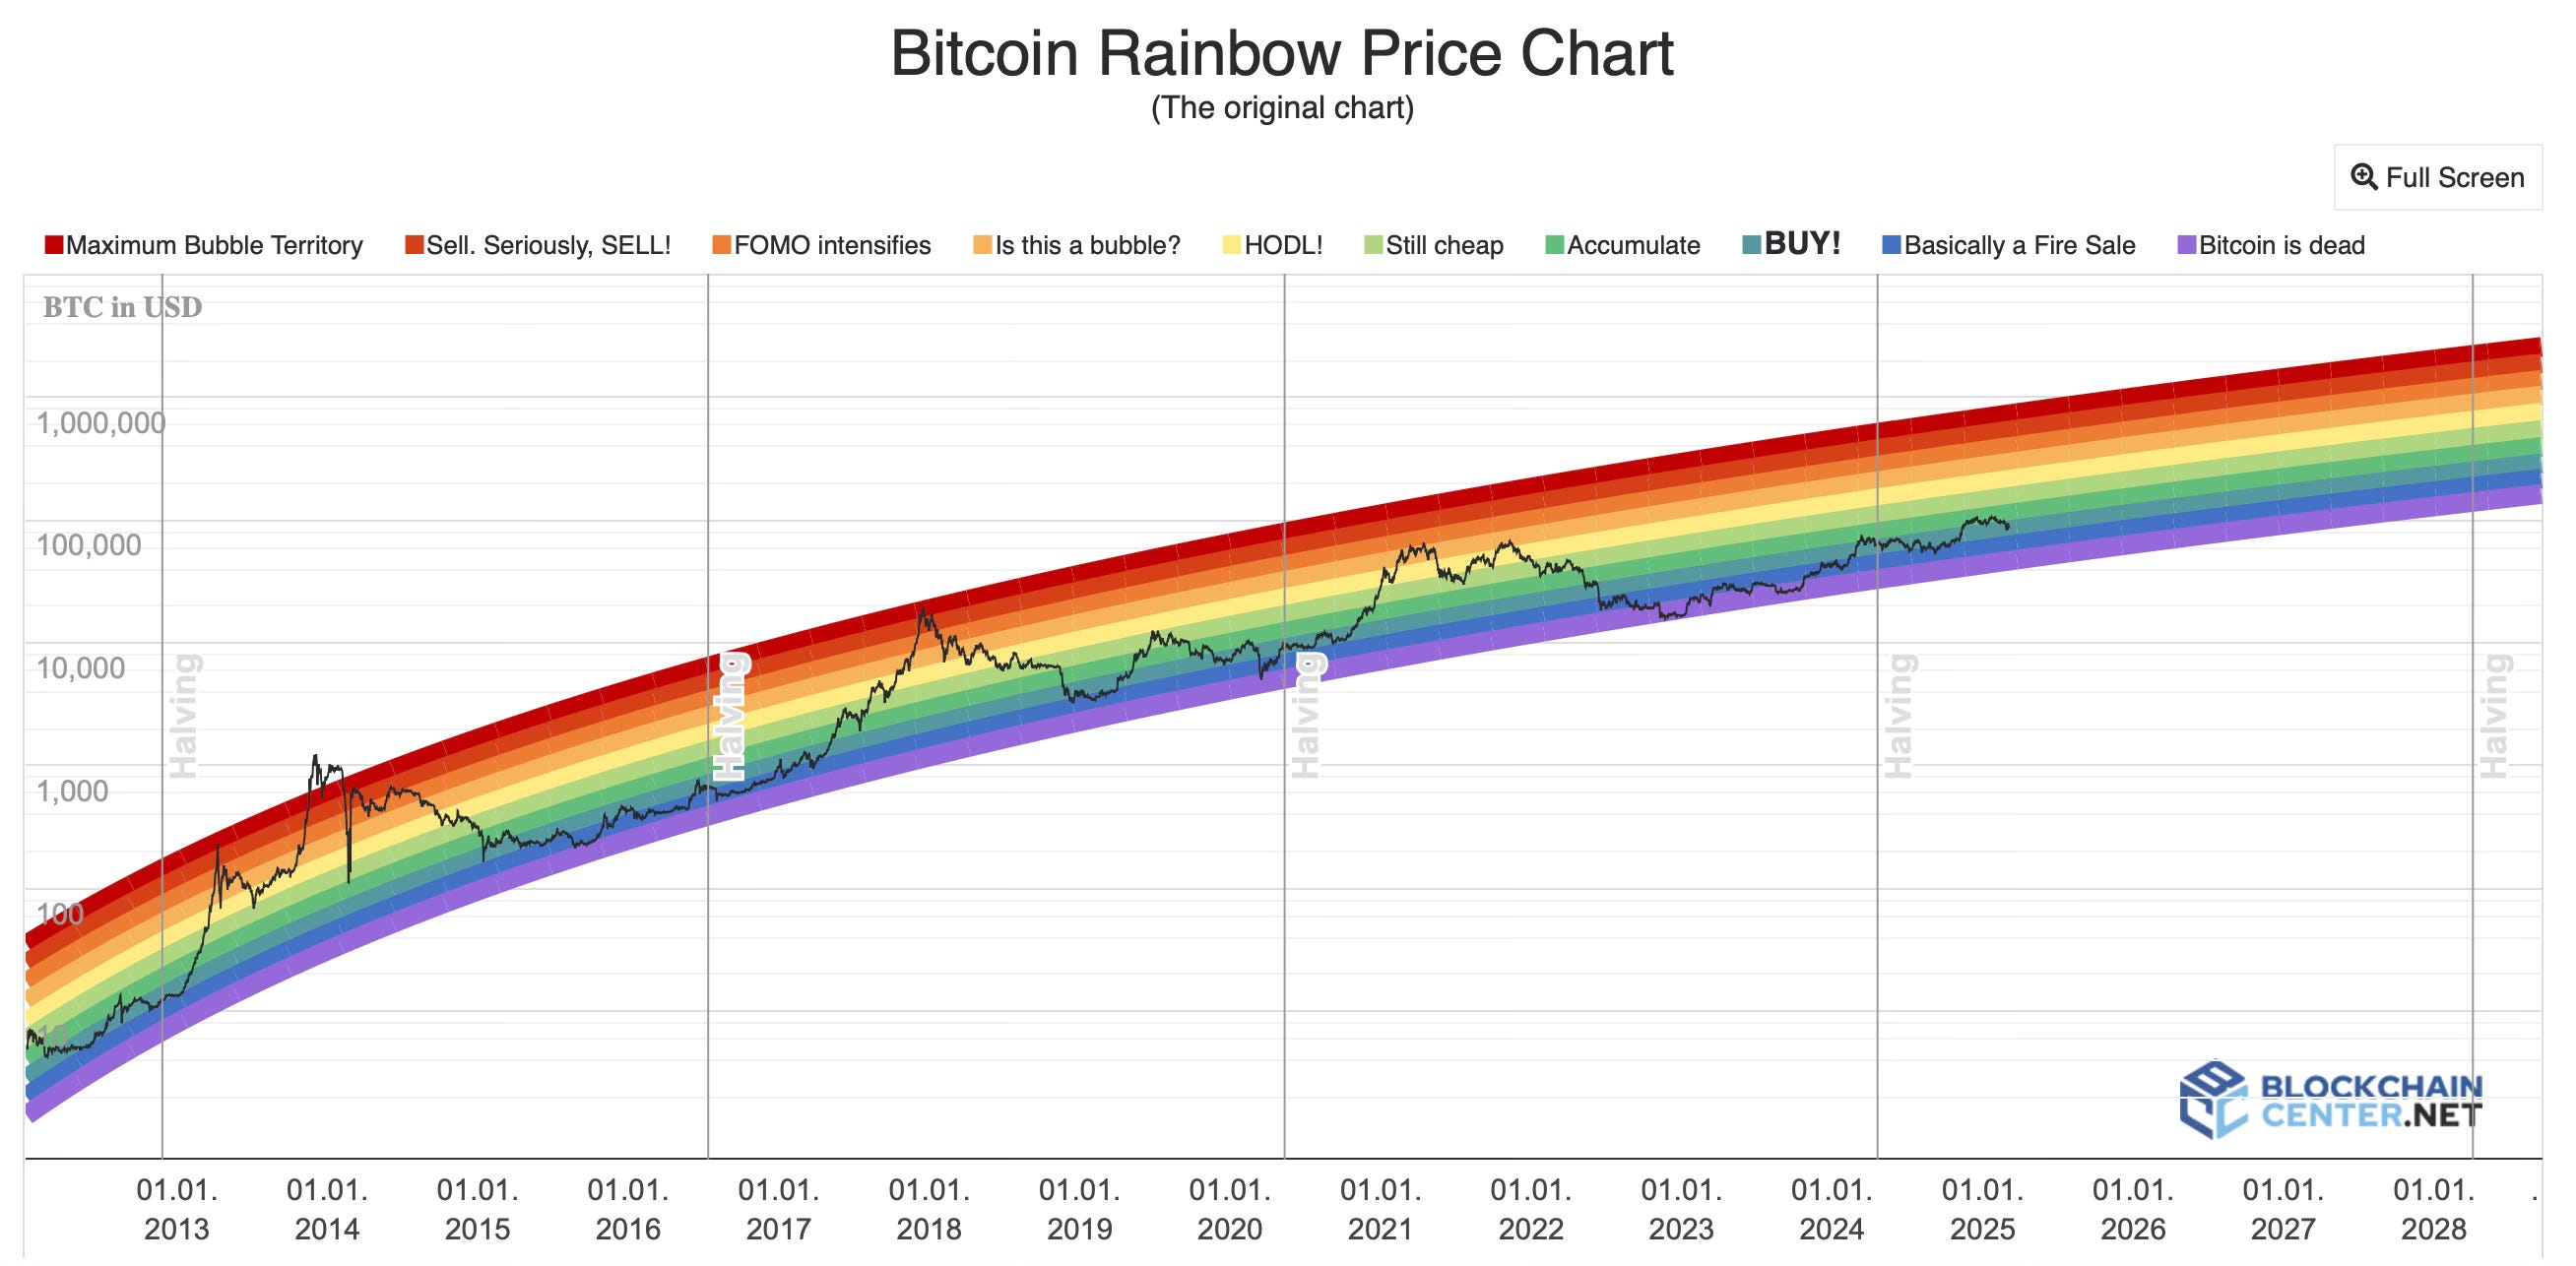
7. BTC Rainbow Chart 🌈
What is it? A logarithmic scale chart plotting Bitcoin's price history, with bands labeled from "crash" to "bubble," based on past cycles.
Why is it important? Visualizes long-term price cycles, helping identify valuation levels. Historically, it has been accurate for bull and bear phases, like the 2017-2018 cycle.
How does it work? Current assumed position in the "blue" zone (middle) indicates neither crash nor bubble, suggesting a stable phase.
8. Global Liquidity 💧
(Like the Rose Bowl, it is arguably The Granddaddy of Them All)
What is it? Global Liquidity tracks the M2 money supply—cash, deposits, and near-money—from major central banks (e.g., Fed, ECB, PBOC) compared to Bitcoin’s price. It shows how much money is available globally for spending or investment.
Why is it important? More liquidity boosts investment in risk assets like Bitcoin, often sparking bull runs (e.g., 2020-2021). Bitcoin’s fixed supply makes it a hedge against fiat devaluation, so tracking liquidity helps predict price moves.
How does it work? The chart plots M2 growth from central banks against Bitcoin’s price. Liquidity rises via rate cuts or QE, driving capital into crypto with a lag. Tightening reverses this. It’s a visual correlation tool.

A major breakout with Global Liquidity could hit any day now… 👀
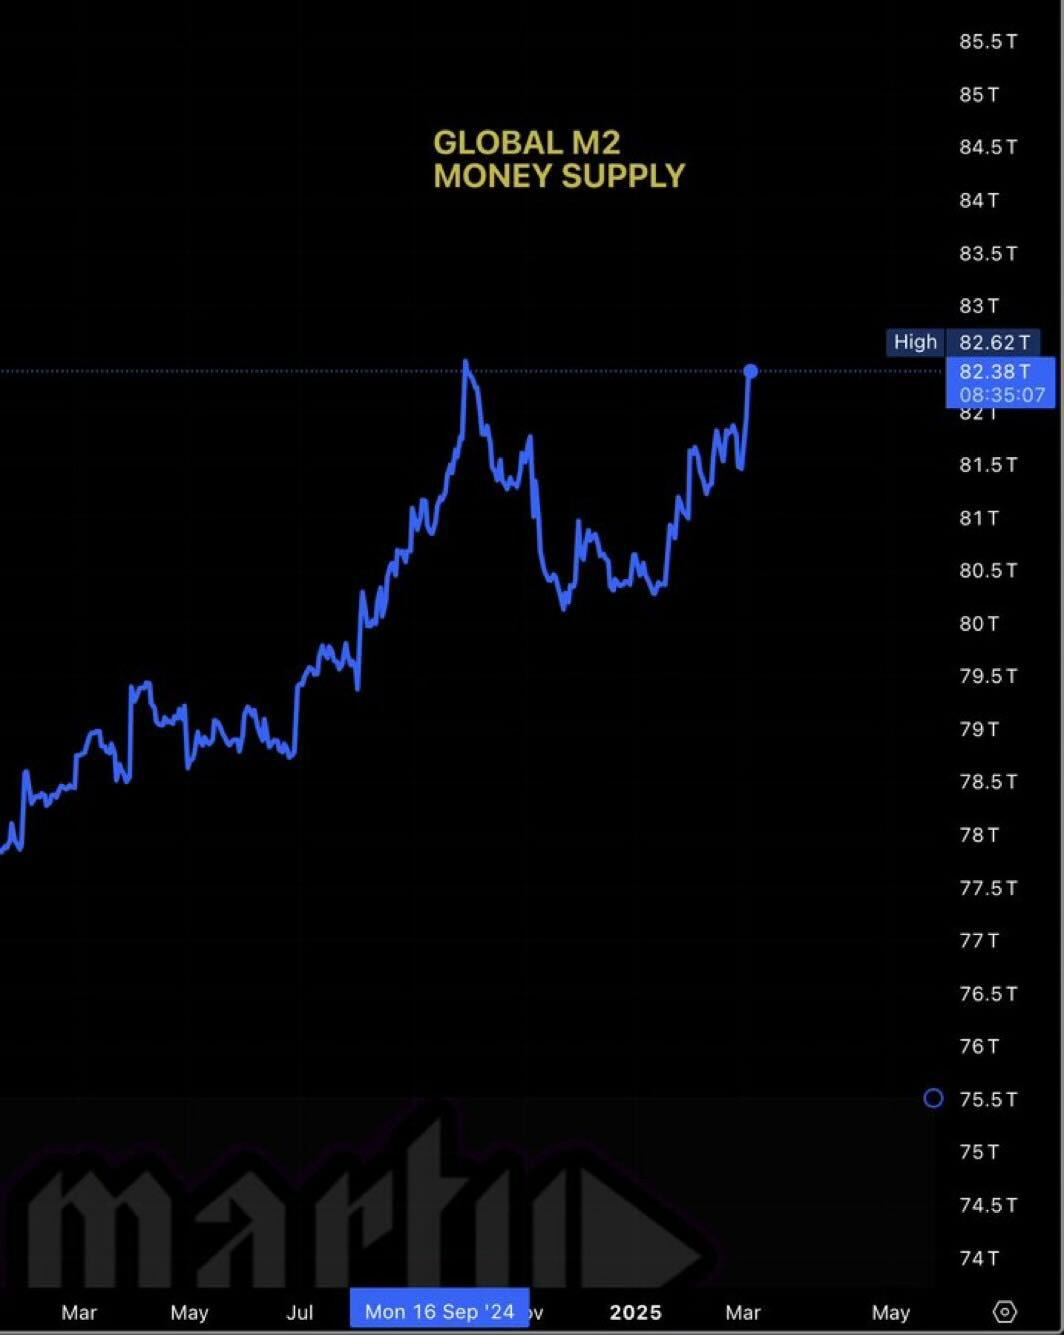
Historically, when this happens, Bitcoin’s price is primed to explode toward Poppy’s next projected all-time high for BTC! 💥
⬇️ Summary of Top Bitcoin Price Indicators ⬇️
Bible Verse
Proverbs 16:3 — "Commit to the Lord whatever you do, and he will establish your plans."
Reflection: This verse reminds us that when we align our ventures with our deeper values, things tend to fall into place. So as you navigate the ups & downs of the crypto market, consider how grounding your strategies in a bit of spiritual insight, alongside using these useful & proven indicators just might just guide you towards steadier & wealthier waters.
Great breakdown of Bitcoin price indicators! Keeping an eye on these metrics can help make smarter investment decisions in a volatile market.